Susan first tried using logic, but her inept attempts at utilizing it turned out to be either incorrect or irrelevant. But futile though they were, those attempts weren't anywhere nearly as embarrassing as her attempt to appeal to the mathematical authority of a random commenter whose claims to be a "PhD statistician" are, to say the least, more than a little dubious.
Susan wrote: "These sorts of graphs reflect aging male fantasy – a sort of 50 Shades of Bray. Enter Kelly, a PhD statistician who takes the top chart apart with math."
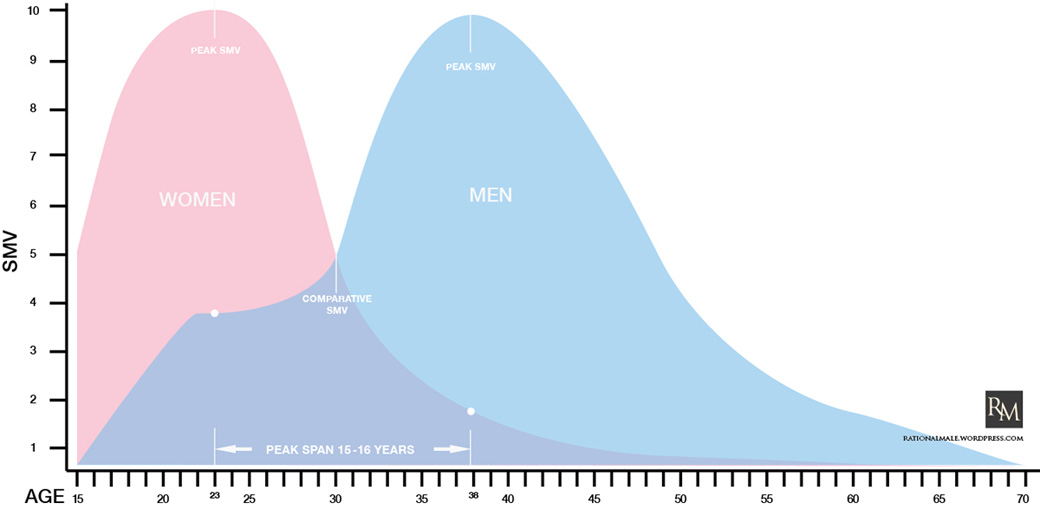
This is never going to make an impact, but as a PhD statistician I am going to tell you why all this red pill crap is wrong. Women peak sooner, but men have a broader peak.The first, and obvious, response is: what math? This attempted refutation isn't based on statistics or math, it is nothing more than nonsensical babbling and Susan should be mortified at taking it seriously, let alone thinking that it "takes the chart" apart in any way. Shall we begin?
1. Those graphs are wrong because, with a fixed number of people in the world, equal between the sexes, you have to scale the curves so that the area under each one is the same.
2. The top valued man is not a “10,” ever…He is downgraded by competition in the market.
He’s some relatively lower value scaled by the fact that men’s sexual prime lasts longer. Why is this, for the non math geniuses out there? Because if there are 50 men who are 7.5′s, and there are only 30 women, then men’s actual score and actual value on the dating market is downgraded because he can’t just choose a 7.5 and take her.
3. There are even more men competing for the same women.
a. Not only does the male curve have a broader prime, and therefore more area, there is another factor at play – women hit menopause around 55, but most men want to keep having sex into their 70′s.
b. Consider that “alpha” males often have several girlfriends, taking more off the market. And women are out of the game for longer to recover from being dumped.
c. Women are more likely to focus on their kids after divorce and stay out of the dating market.
d. There is even less area under the female curve because the super attractive part up until age 18 is not even legal for sex.
This all serves to downgrade men’s real value on the dating market.
So take that blue curve, and shrink it until the area underneath is the same as the area underneath the women’s curve. This is why women tend to date men 5 years or so older, rather than 16 years older. A lot of this red pill stuff is wishful thinking. There is a little truth to it, but the relative lesser availability of women overall makes it a weaker effect.
If you looked at the curve and said to yourself, “I am going to be a 10 at age 36!” you are probably only going to be a 7.5 because your whole curve has shrunk, due to you competing with a whole lot of men. There is a giant tranche of men who are 6′s and 7′s who are going to be competing for a much smaller tranche of 6-7 level of sexual attractiveness in women. Many will have to either settle or be alone.
- The SMV chart is not the entirety of "the red pill".
- It is unclear what she means by "women peak sooner but men have a broader peak". Is she making a statement or falsely describing the chart? The chart shows women peaking sooner AND having a broader peak.
- It is very clear that Kelly has not understood that 10 does not represent "the perfect 10", but rather, the individual male's peak. It is impossible for a man to never reach his own peak sexual market value. And worse, if the mere existence of competition in the market intrinsically degrades one's sexual rank, how can there be female 10s? Kelly's statement assumes that there is no competition in the market for women, which is obviously false.
- We finally reach "the math". First, note that it is a hypothetical if-then statement and there is no reason to believe it is applicable to the real world. Second, it is incorrect: she is still confusing individual peak SMV with overall SMV rating. Third, even if we utilize the latter, a 7.5 paired with a 6 does not reduce his sexual market value, it merely means he has Hand in the relationship. Fourth, she again forgets that what she asserts about men would apply to the female curve as well. And fifth, I note that the only "math" presented here is the controversial notion that 50 is more than 30.
- The assertion that there are more men competing for the same women as they get older would be indicative of plummeting female sexual market value for most women, not disproof of it. In such a situation, the demand may remain high for some women due to the supply-demand curve, but the overall supply has dwindled. And even that is dubious, for the obvious reason that men can simply date younger women... as we observe them to do.
- There is absolutely no reason for there to be the same area underneath both curves. This is begging the question, it is not a refutation. She might as credibly have insisted on coloring the blue area yellow and claimed to have refuted the chart on that basis.
- Again, "the lesser availability of women" presumes declining female attractiveness.
- Kelly leaves out an obvious option. Men who are 6s and 7s who cannot find women of similar sexual market value their own age are not doomed to either settle or be alone, as they can also pair up with the more plentiful younger women of similar sexual market value.
67 comments:
Please. This "mathematician" is so clueless you shouldn't even argue with her. From not so subtle clues I see that this "statistician" just confused the graphs for a gaussian bell curve distribution http://en.wikipedia.org/wiki/Gaussian_distribution.
Because if those graphs really were the gaussian distributions then
- the areas below them indeed had to be the same
- the male graph, being wider, indeed should have been lower
And honestly I couldn't invent how one could interpret those data as distributions. If the X-axis is age, then Y-axis should have been quantity. But it's not. Any other ideas?
I suppose the so called scientist hasn't even read what the axes were marked.
Don't show her a Venn diagram. She might try to contradict that with math, and hurt herself.
Her analysis also appears to fail to get that the main argument from Rollo is an individualist one, and the Hussies are collectivists.
"He’s some relatively lower value scaled by the fact that men’s sexual prime lasts longer. Why is this, for the non math geniuses out there? Because if there are 50 men who are 7.5′s, and there are only 30 women, then men’s actual score and actual value on the dating market is downgraded because he can’t just choose a 7.5 and take her. "
Looking at a population chart, following a cohort of the general population, the percent female increases over time with higher male mortality.
Therefore, tracing this same cohort, if the situation she describes actually happened, given that the Hussies are more than happy to say that the women had higher SMV in their 20s, means that there is some point at which the fraction of men >= 7.5 exceeds the fraction of women >= 7.5, which means that things started to go south for that cohort's women. You could pick any number - e.g., if you had picked 5, then you would be saying - there are more female dogs as time goes on in a particular age cohort. This, of course, would say that Rollo was correct and women peak earlier and fade.
What's quite funny is I believe that there was a strong element to Rollo's original chart saying that this was the potential trajectory of an individual, and this statistician is too stupid to realize that the fact that there are always new young, hot chicks does not in any way change the fact that there are aging spinsters, unless she presumes that the young, hot chicks are just going to be either economic substitutes for the spinsters (and so men just keep trading) or we're going to just kill the spinsters and take them off the market permanently.
I think part of their blindness is that they cannot get over their ovaries, and cannot see individuals, but rather want to cling to that pink one being always and forever Julia, Team Woman, not the probability space for a single woman's SMV.
Further, what's always confused me about this sort of thinking - isn't "10" representative of the peak on your side? If she doesn't think a male 10 is worth it, or would prefer to pretend that the female 10 is something better and all men are below her (because, you know, she has to think she's a 10), she can either be a spinster and live with her fantasies or she can go become a lesbian - I don't think anyone here would care either way.
Your #3 is the crux of it: she thinks the curves represent the entire population, instead of the average man or woman's progression from low attractiveness to his peak (his personal "10") and back down again. The rest of her irrelevant blathering about being a math genius and calculating the area under a curve all stems from that. I have zero math degrees, and I understood the chart right away. How embarrassing for her.
Enter Kelly, a PhD statistician.
@cailcorishev . Don't show her a Venn diagram. She might try to contradict that with math, and hurt herself.
She would probably think i omething to do with "Charmed".
Some people need to stay away from sharp things, including the minds of others.
" 1. Those graphs are wrong because, with a fixed number of people in the world, equal between the sexes, you have to scale the curves so that the area under each one is the same."
(I'm still trying to figure out what she takes as the significance of the integral here that would lead to this scaling at the population level..I think this is where she goes off the rails and starts to ask for scaling - the height difference between male 20 and male 35 on that chart says nothing about how many men age 20 or men age 35 are dating...SMV is the derivative of what? Is she trying to compute how many marriages? partners? couplings?)
" a. Not only does the male curve have a broader prime, and therefore more area, there is another factor at play – women hit menopause around 55, but most men want to keep having sex into their 70′s."
Continuing with her assumption - hers, not mine - that menopause means that women stop having sex (she has never been to a nursing home, has she?) - wouldn't this then mean that those women who hit menopause have their individual SMV go to zero?
Thus, even her argument thinking that this is the collective graph of a population and so must be equal in area (which seems incredibly wobbly to me, as I'm still stuck on why SMV is the derivative of population...there is birth control after all) is false, because the male graph would, according to her collectivist view of it, have those men 55-70 who are still in the sexual marketplace, so must have some nonzero value, but the women 55-70 are not in the graph because their value is zero?
I think it's just hard for them to grasp: If you accept that there is an ever-growing number of men competing for a specific SMV value of women, as they like to laud, and, as a population cohort ages, there are more women than men, which they don't challenge, and, if we take their argument that there's some additional limiting value on SMV for men so that we're overestimating male numbers, so that the male SMV doesn't grow fast, those women must hit that wall hard and lost it fast.
It's fun how statistics doesn't require you to be consistent.
Note the bigger picture - SMV is the result of feminism and the hook-up culture. The old track was beautiful young woman marries and has children, as her SMV drops, her value as a mother increases. It was more fufilling and everyone was happier. But like in Eden, we thought the fruit would make us happier and we became miserable.
Women seem to liberated from their mainly from their senseibility. Hamster unbound!
"Kelly, a PhD statistician"... who's very existence casts a serious doubt on the credibility of higher education.
The area under the curves should be the same because of demographics? We're not measuring people you blithering idiot. We're accounting for human sexual attractiveness. The area under the curve has nothing to do with population or demographics. 1 man and 1 woman... or 1000 men and 5000 women. It is irrelevant.
Susan is getting old - the chart says this makes her less valuable - she doesn't like this - her solipsism drives the hamster forward which is tasked with finding a solution - therefore the chart doesn't count. Anyone who attempts to confirm this in her head is "right" because gosh darn it she wants it that way and morning mirror be damned.
Her statistician sounds like one of those cute kids in the AT&T commercials. But maybe not as smart.
"I'm still trying to figure out what she takes as the significance of the integral here that would lead to this scaling at the population level."
Exactly. Her whole analysis is totally bizarre because from the very beginning she doesn't understand what the chart is representing.
Lies, damn lies, and hamsters with PhDs.
I'll cut Susan a bit of slack. I think the point she was trying to drive at was that the "wall" is more of a slope. A woman does not turn from a 10 into a 1 overnight. And that slope can be gentle for a woman who takes care of herself and dresses well.
The way i look at it, Susan is tackling one of the biggest challenges - that of persuading young women to think with their brains and not their hormones. Much of what she's putting out is the sort of advice that our great-grandmothers would have consdered obvious.
Your great grandmother would have advised not hooking up in the first place and she would know that the wall is real and would be very thankful for husband goggles. Susan advocates the first, denies the second, and pretends the third isn't necessary. If she was stereotypical of our great grandmothers then America would already be in the grave and would be whatever its shaping up to be now.
There seems to be a fundamental misunderstanding here - that 10 in the chart represents SMV 10 in the marketplace - as if every single man is a 10 at 38. No, it represents the ratio of what your SMV is likely to be at a certain age in relation to the highest SMV you are likely to ever have. That's why it doesn't have to have a unit area - because the actual distribution of absolute SMV in the general population is not shown, but only the function that modifies it by age.
However, I think the chart wouldn't have had this ambiguity if it said 100% and not 10 on the top.
A site that is built on "hooking up" is inherently flawed. Long term stability is not built on "hooking up"!
I find it amusing that "hus" means "shoo!" in Finnish. As that's exactly what the site does to men.
The wages of Chick Math.
"Enter Kelly, a PhD statistician."
- Can I at least buy her a drink first?
In short, I don't find this as conclusive evidence that this PhD's statistical prowess is catastrophically inept. Only her comprehension.
I'll cut Susan a bit of slack. I think the point she was trying to drive at was that the "wall" is more of a slope. A woman does not turn from a 10 into a 1 overnight. And that slope can be gentle for a woman who takes care of herself and dresses well.
The way i look at it, Susan is tackling one of the biggest challenges - that of persuading young women to think with their brains and not their hormones. Much of what she's putting out is the sort of advice that our great-grandmothers would have consdered obvious.
I would be inclined to agree there. At the same time, she does seem to be downplaying the reality of the "wall". It is a big deal, and it is something that every gal needs to consider as she enters adulthood.
If she wants to marry well and have children, then her optimal time window is not as wide as she might think. If 27 is where she starts sloping down, that means she has a 9-10 year window AT BEST.
During that time window, the choices she makes will either help or hurt her, and the ones that are being marketed to her--college, grad school--may very well work AGAINST her.
And if, during that time, she enters any sexual relationship, it works AGAINST her rather than FOR her. If she gets in with the hookup culture, that will send her marriageability southbound in a hurry.
Throw in those factors, and the "slope" indeed becomes a concrete wall that is not particularly forgiving.
Susan has written many pieces critical of feminism and the hookup culture. She has also been slightly skeptical of the higher education paradigm.
At the same time, either she is downplaying the problem, or does not understand the gravity of it.
My biggest problem with Aunt Giggles isn't her trolling of the manosphere to generate site traffic for her failing rebrand of HUS, it's her ideological dishonesty and willingness to prostitute herself to fulfill what I can only guess is her need for catharsis online.
I didn’t included it in this write up, but one thing that really bothers me about Suz' bit is this assertion:
2. Fertility declines very gradually between the ages of 27 and 35.
In a study of 782 couples:
They found that women between the ages of 19 and 26 with partners of similar age had approximately a 50 percent chance of becoming pregnant during any one menstrual cycle if they had intercourse two days prior to ovulation. For women aged 27 to 34, the chance was 40 percent.
3. Fertility declines more dramatically after 35.
Even then, female fertility hardly goes to zero:
For women over the age of 35, the probability dropped to 30 percent.
Notice how the male sexual value begins its precipitous drop at around 36, after declining gradually for five years. Not much difference.
She knows this is flagrant, potentially damaging, bullshit, but posts it because it makes good copy for her rebrand and her ignorant girl-world readers will eat it up. I say it’s flagrant bullshit because she knows better and has posted about it in the past:
http://www.hookingupsmart.com/2011/12/15/relationshipstrategies/the-grim-beeper/
And that was around the same time I wrote the Myth of the Biological Clock:
http://therationalmale.com/2011/12/02/the-myth-of-the-biological-clock/
I should also add that as Susan approaches 60 I expect she'll be promoting the Grannies Gone Wild meme in direct proportion to how close she gets to the assisted living facility:
http://dalrock.wordpress.com/2013/02/27/grannies-gone-wild/
I mean, hell, why stop the feminine SMV train at 55, when apparently 80 is the new 20:
http://nypost.com/2013/02/26/randy-grands-take-over-online-realm-number-of-seniors-playing-the-field-more-than-doubles/
Interesting. From that HUS link 2 years ago:
------------
A recent survey found that women dramatically underestimate how much fertility declines with age. They estimated that a 30 year-old had an 80% chance of getting pregnant in one try. The real likelihood is 30%. They also thought a 40 year-old woman would have a 40% success rate, while those odds are less than 10%.
[...]
So why aren’t women getting the message? How can women with master’s degrees have such a poor understanding of their own bodies? Three guesses, the first two don’t count.
“A decade ago, a campaign by the American Society for Reproductive Medicine sparked a vicious backlash. Ads on public buses in several big cities featured a baby bottle shaped like an hourglass, to warn women their time was running out. But women’s rights groups called it a scare tactic that left women feeling pressured and guilty.”
So now they’re feeling barren and depressed instead.
The prognosis for marriage is grim. We need to take our heads out of the sand and speak the truth about this issue. It’s too late for the generation of women in their 30s and 40s today. Those of you in your 20s can have marriage and a family if you want it, but you can’t have it all. My generation of feminists lied to you about that.
In short, I don't find this as conclusive evidence that this PhD's statistical prowess is catastrophically inept. Only her comprehension.
Right. It's a bit like an expert auto mechanic seeing a Ford and insisting it's a Porsche. Or maybe a banana.
We might as well be arguing over how many angels fit on the head of a pin. What is the source of the graph? Is it based on a study? Population statistics? I'd be surprised, that moron Rollo couldn't even tell you what a ratio is. If a female statistician with math skillz is laughable, how much more so a man who majored in psychology doodling on graph paper.
Or, like so many other things in the manosphere was this graph pulled out of someone's ass because it "feels right" and validated a thousand times over by this herd of losers all to eager to agree with each other.
Or, like so many other things in the manosphere was this graph pulled out of someone's ass because it "feels right" and validated a thousand times over by this herd of losers all to eager to agree with each other.
That may or may not be, but regardless, even if it were the case, it wouldn't change the fact that "the math" was not correct and the criticisms were observably false.
you're smelly, but what do I smell like?
The problem with the chart lies in the name: SEXUAL market value.
The reasons someone may want to form a relationship vary greatly.
If it's pure sex, then you can certainly argue that a man's value drops off after 30.
If it's to marry then you can say that a man's value goes up after 30, because the most important things a man brings to a marriage (stability, income, etc) are higher in an older man.
But when it comes to a woman's value in marriage, it drops like a rock when she hits 30, because the single most important thing she brings to a marriage (the ability to have children) also drops like a rock. If you were a man looking to marry and have children, how would you rate the following as potential wives?
1) ugly 20 year old
2) homely 25 year old
3) attractive 30 year old
4) very good looking 35 year old
5) stunning 40 year old
#4 &# 5 are out of the running, because the odds are low that they could produce even one healthy child.
The odds that #3 could produce more than 2 healthy children are low, so unless you are set on a small family she's out also.
#1 and #2 are the only realistic choices if your goal is to establish a family (and if you want lots of children--say five--then #1 is your only choice.
A person's value to a relationship is different depending on the type of relationship and the goals of the relationship.
A man's value in particular depends on what the woman is looking for in the relationship. Pure sex = wants younger guy. Marriage and fathering children = older guy.
And, a woman's value is depends on what a man is looking for in a relationship. Pure sex = younger woman. Marriage mothering children = younger woman.
And there is the real difference between a man's and woman's "market value." A man's market value goes up over time, because the market he is in transitions over time from sexual to marriage market, and an older man has more value in the marriage market.
A woman's value goes down over time, because she is at her highest value in every market (both sexual and marriage) when she is young. Consequently, when she gets older she has no market to transition to. She goes form simultaneously being in the marriage & sexual markets to...what?
That may or may not be, but regardless, even if it were the case, it wouldn't change the fact that "the math" was not correct and the criticisms were observably false.
Exactly. PUTTING ASIDE for a moment the exact validity of the chart, what was absurd was grabbing a RANDOM COMMENT off a blog and prominently displaying it in a post as a mathematical refutation which was complete garbage.
As she is prone to do, Susan is now backpedaling and obfuscating on the thread with a guy trying to explain the math and trying to deflect from the original absurdity of using Kelly as a source
"5) stunning 40 year old"
How did she look when she was 20? because the curve probably still applies to her.
That may or may not be, but regardless, even if it were the case, it wouldn't change the fact that "the math" was not correct and the criticisms were observably false.
In other words, it is, and you're pointing out that the good lady's objections are logically invalid as applied to the turd cake your half-witted buddy just pulled out of the oven. If you were a bit more intellectually honest, you'd be aware that there is a bigger issue to contend with here, namely that the cake is made of bullshit, your friend is a retard and arguing over the shape of the cake is not as important as bailing out of the whole situation.
LOL...Susan is over on HUS accusing people of catfishing...looks like she is doing some of her own....posters youresmelly and Morphish....Hi Susan.
Dude, check your pussy, is it alarming out? Criticism does not equal allegiance with your enemies.
"Dude, check your pussy"
Criticism does not equal allegiance with your enemies.
Really, really dumb criticism is a pretty strong indicator. As to your original point, you're just trying to change the topic and no one here particularly cares. The fact is that Susan presented some really terrible arguments while calling them good statistical analysis.
"Kelly, a PhD statistician" has a good point, but that point is also completely consistent with Red Pill thinking and making the appropriate adjustment would make the difference between men and women even more dramatic because it would highlight the fact that AGE is much more of a FACTOR in SMV for women than it is for men.
The problem is that the graph doesn't just show an individual's distribution, it also compares a man's distribution of SMV to that of a woman. Let's suppose that the graph accurately captures men and women's individual SMV distributions relative to age. The implication of the greater area under the male curve is that men have more SMV on average or put another way that the total lifetime SMV of a man is much greater than a woman. That's not true. Eggs are rare and sperm are plentiful.
If the curve represents the MEDIAN man and women then the area under the pink curve should be greater than the area under the blue curve, but at the very least it would make sense to set them equal as we would expect if we're looking at the AVERAGE.
If we want the curves to allow a comparison of men and women then having men and women reach the same peak doesn't make sense even if we're only looking at individual distributions.
If women have 20 years of fertility comparable to 40 years for men, the high plateau for women should be on the order of 2x higher, but again that change would only make the Wall even more dramatic.
Mercy
Mercy, that graph simply says that women reach their attractiveness peak sooner, and lose it quicker, while men reach their attractiveness peak later, and lose is slower.
You could fine tune these ages a bit, and then of course some people are always ugly and never really peak.
In short, men like youth, and women like confident successful experienced men - which usually takes time to accomplish. If / when you get to a place where you have the confident / success / experience, your value pretty much stays there while your body deteriorates, but that can be worked on.
Men dont value confidence success experience in women, so the aging process brings nothing on the table, it just takes it all away.
Isn't this graph just showing what women have been saying for decades: that girls mature sooner than boys?
In other words, it is, and you're pointing out that the good lady's objections are logically invalid as applied to the turd cake your half-witted buddy just pulled out of the oven.
No, that is a false restatement. First, speak for yourself, not anyone else. Second, understand you can't rescue Susan's hapless illogic or Kelly's non-mathematical "math" by attacking an inanimate graphic.
Yohami said... "5) stunning 40 year old" How did she look when she was 20? because the curve probably still applies to her.
For purposes of discussion, let's say she LOOKS exactly as she did at 20--a 10 that hasn't aged a day in 20 years. So, from a purely SEXUAL market value let's say she's still at the top.
But, where is she on the MARRIAGE market value? Zero, because no matter how she looks she can't produce any children.
That's why a person's overall market value can't be measured in isolation.
8to12
If she looks "the same", say, like this other 40 year old girl http://bestkeys.net/wp-content/uploads/2009/10/Teen-Its-Me-Verry-Sexy-Girl-Msn-or-Cam.jpg
Her value will be pretty high.
When you say "stunning 40 year old" you're poisoning it. Or, imagine a stunning, really beautiful 98 years old woman. Did you imagine the girl on the picture, or did you imagine an old lady?
In other words, no, the 40 can be stunning for her age but wont and cannot look the same. In the unlikely that she is a vampire and she DOES look 20 or younger, you'll see pile and pile of men wanting to marry her and more. Age matters as long as its noticeable.
I think the bigger realization here is that no one really doubts Kelly's claim to have studied statistics for 8-10 years. We're all kinda taking that in stride.
aeolipera
I think that many of us, myself included, fully doubt Kelly's claims to have studied statistics, not only for 8-10 years but much at all. The is absolutely no basis at all for saying the areas under the curve should be equal or that a male 10 cannot exist.
Should read: "There is absolutely no basis...."
Math may describe reality, but it is NOT the reality. One must be very careful to understand that the map is not the terrain.
I'll also agree that we all, including Susan, need to separate desirability, fertility, and marriageability. There's overlap, but they are not the same. Different people are using the same term (usually SMV) for different things.
I'll just leave this here since PZ is too much of a pussy not to use dontlink.com:
http://freethoughtblogs.com/pharyngula/2013/10/24/13609/
Oh sweet Darwin! I'm saving that post before someone explains to him what the chart actually indicates. He's making exactly the same mistake Kelly the Statistical PhD made.
It's almost as bad as his mistake about homo sapiens sapiens was, but at least this isn't directly related to his actual scientific discipline.
http://freethoughtblogs.com/pharyngula/2013/10/24/13609/
Just checked out the post and comments. Reminds me of one of my favorite quotes:
All truth passes through three stages. First, it is ridiculed. Second, it is violently opposed. Third, it is accepted as being self-evident.
Arthur Schopenhauer, German philosopher (1788 – 1860)
Much of the manosphere/red pill truths are now in that ridicule stage perhaps slightly moving to violently opposed. The reason for this is they are now getting on many people's radar screens. I expect the violent opposition to only increase. I don't recall the details but some guy got blasted for basically saying feminism wasn't making women happy and his wife's job as a mother was more important than anything else.
I was reading some of the comments...all sorts of pseudo-scientific, pseudo-logical criticism especially about the lack of testing/scientific method. It occurs to me there is a very easy, simply way to test this. Look at the ages and earnings of strippers. There is probably no purer metric of a woman's sexual power than the ability to extract economic resources out of a man.
And here is the reality. Most strippers make their top money in their early to mid 20s, over 30 to say 40 it declines a lot, and then after 40 there really not any strippers who can make money.
One could also look at porn stars and who the top money makers are, and what their ages are. It is amusing to see so many people argue so violently against something that is fairly obvious if you simply think about the observable evidence.
Totally agree, Morpheus, but that would contradict the feminist and go-girl meme that "40 is the new 30!"
http://freethoughtblogs.com/pharyngula/2013/10/24/13609/
Ho man. It reads like some sci-fi robot trying to process illogical statements. "What are the units? There aren’t any." "What does that even mean? It’s dimensionless." "It doesn’t even make sense to put this into a chart [Warning CPU overload]".
the only reason the areas under the curve would be the same is if you assume 1. the graph is sexual demand/ sexual supply graphed as a relation to time (typical woman think) 2. and you assume that value is 1 over a lifetime for both sexes in which case the closed integral over a lifetime with respect to time would be the same. Both these assumptions are false. Which makes one wonder why one would even post this graph as it seems from her statement that she thinks that the value for women is higher than that of men, which clearly violates assumption 2.
Also typical woman think: Never wholeheartedly agree with anything even if its true. If you can find some excuse to say somethings headed in the right direction, but at the same time can socially distance you from anything that's considered extreme by general populace you take it even if its complete b.s.
I was curious so I Googled most popular female pornstars and here is an article from July 2013
http://www.therichest.com/expensive-lifestyle/entertainment/the-top-10-most-popular-current-female-porn-stars/
1. Tasha Reign - 24
2. Asa Akira - 26
3. Jessie Andrews - 21
Maybe I am missing something, but they all look under 30 to me. I don't see a single woman over 50, not a single woman over 40, not sure if any are over 30. Is that because there is something that makes over 40 and over 50 types opposed to doing porn for moral reasons, or is it more plausible that a woman 40+ has a minute fraction of the sex appeal of a woman 20-25 and thus would have no demand for her?
Desiderius,
Wanted to say congrats!
Is that her picture in the YouTube video a few posts before? She looks a lot worse than the snippet picture with her posts. Aging does hit some hard and that could be part of her motivation for the radical change of course,
Wife goggles may help in marriage (and I am glad I have them for my wife), but a visual shift like that is far more jarring if I am seeing what I think.
How is she going to develop a following of 20 year olds when she is clear las old or older than their mother? Tough target to hit, even though that seems her aim with a recent advice post.
@Morpheus
"As she is prone to do, Susan is now backpedaling and obfuscating on the thread with a guy trying to explain the math and trying to deflect from the original absurdity of using Kelly as a source"
I think that guy got his latest comment deleted (he alluded to the graph from Andrew at Rules Revisited), but I don't see that comment anymore.
Oh well...
Another great moment in performance arts' newest sub-genre: hamster theater. AVFM has its whole 'RegisterHer' thing for nasty girls. We need these great moments in the history of hamster theater likewise recorded somewhere, for our own considerable amusement, and that of coming generations...
I think that guy got his latest comment deleted (he alluded to the graph from Andrew at Rules Revisited), but I don't see that comment anymore.
Oh well...
Ex NY,
I see that the comment was restored....LOL. I guess she still wants to create the pretense that some debate is allowed.
It's funny...I always thought you were one of the most chill, mellow commenters...hardly any MRA or Red Pill "warrior" so it is kind of funny (perhaps not the right word) to see you get jumped all over with your comments on the Atlantic article. Seem to me with women once you unleash the Krakon of censorship and controls on "tone" there is nowhere that it stops. It just takes foot by foot and inch by inch until all discussion is bland and no dissenting views from the party line are allowed
@Mike C.
It was interesting seeing that comment return. I also noticed that my Yakov Smirnoff joke also got undeleted. Really, Yakov Smirnoff.
So you're on the JFG blog?
@Mike C.
It was interesting seeing that comment return. I also noticed that my Yakov Smirnoff joke also got undeleted. Really, Yakov Smirnoff.
So you're on the JFG blog?
I think it is Morpheus, Han Solo, Ted D, and Obsidian. :)
@Mike C.
Ok. So that's where all the guys went. I've been out of touch, especially with all the name changes...
Post a Comment
NO ANONYMOUS COMMENTS.